12 Citing Figures, Tables & Sections
When you’re writing a report, you often refer to a table or figure in text.
Australia’s life expectancy has increased a great deal over the past 50 years (Figure 1)
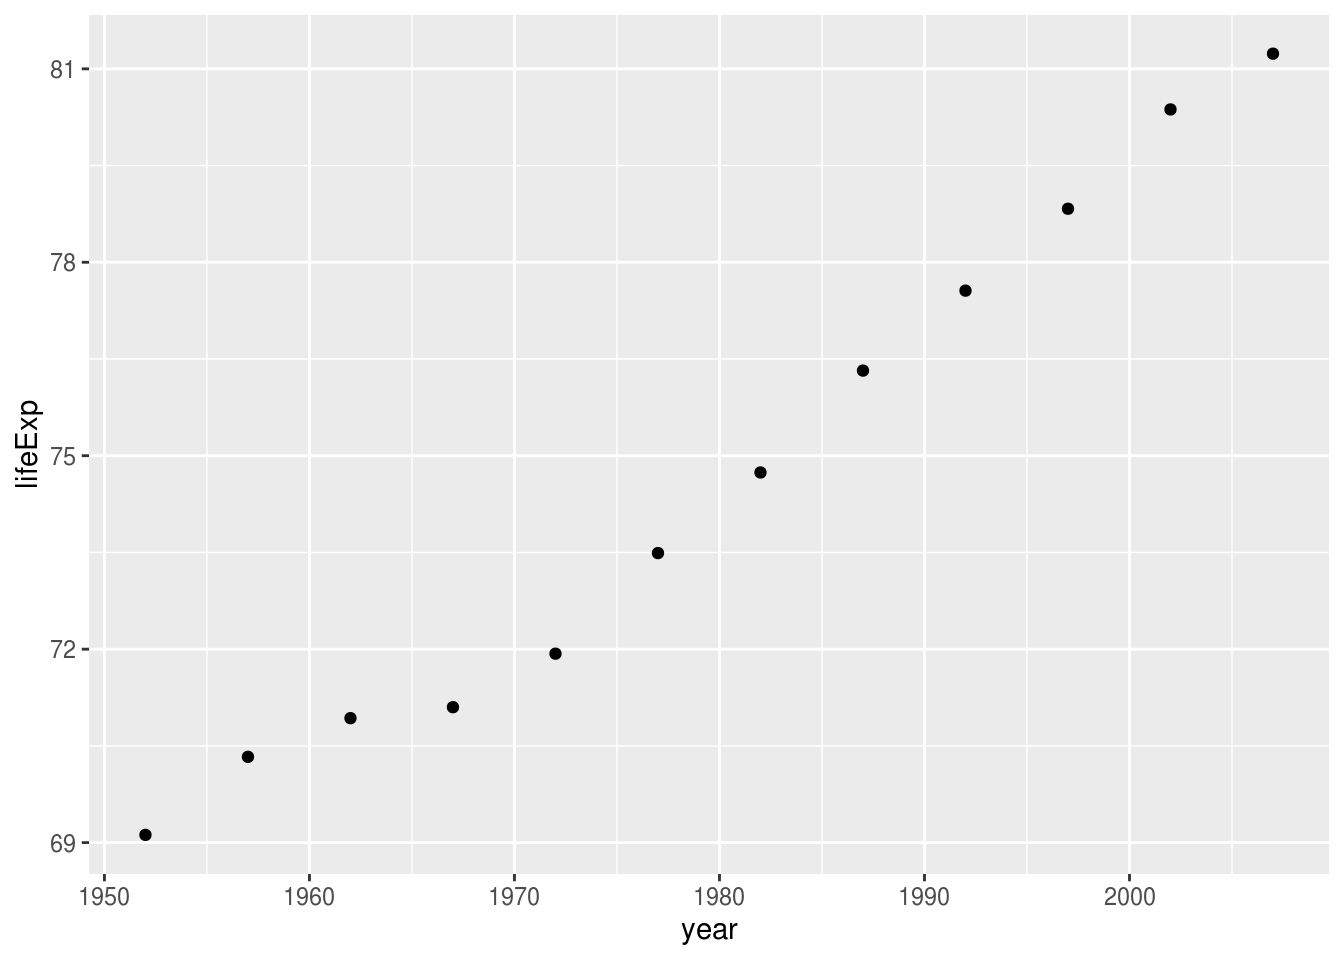
Figure 1. Life expectancy from 1952 - 2007 for Australia. Life expectancy increases steadily except from 1962 to 1969. We can safely say that our life expectancy is higher than it has ever been!
And sure, this is figure 1. But what happens if actually, that figure should be moved later in the paper? You need to do the following:
- Update the reference to figure 1 in the text.
- Update the figure 1 caption to not say figure 1.
This is fine.
Once.
But it is never once. After this, it is frustrating, and error prone.
There is a way to solve this, which this lesson discusses.
12.1 Overview
- Teaching 10 minutes
- Exercises 15 minutes
12.2 Questions
- How do I refer to the table or figure in text and link to it?
12.3 Objectives
- Link to tables or figures in text.
12.4 How to refer to tables and figures in text?
In order to use this referencing style, you must use the following in the YAML
output:
  bookdown::pdf_document2
Or for HTML:
output:
  bookdown::html_document2
Or for word:
output:
  bookdown::word_document2
This is a new version of document that supports a better way to reference things in text. This reads as:
Make the output the HTML/PDF/Word document from the bookdown package.
That is, the special :: after bookdown, bookdown::html_document2 read as “The html_document2 function from the bookdown package”.
12.5 Your Turn
- Convert your output to use
bookdown::html_document2in your YAML.
12.6 Referencing a figure
To refer to a figure, you write the following in your text:
Figure \@ref(fig:chunk-name))
12.6.1 Demo
```{r gg-oz-plot, fig.cap = "Life expectancy from 1952 - 2007 for Australia. Life expentancy increases steadily except from 1962 to 1969. We can safely say that our life expectancy is higher than it has ever been!"}
library(ggplot2)
library(dplyr)
gapminder %>%
  filter(country == "Australia") %>%
  ggplot(aes(x = year,
             y = lifeExp)) +
  geom_point()
```

Australia's life expectancy has increased a great deal over the past 50 years

(See Figure \@ref(fig:gg-oz-plot))library(ggplot2)
library(dplyr)
gapminder %>%
filter(country == "Australia") %>%
ggplot(aes(x = year,
y = lifeExp)) +
geom_point()
Figure 12.1: Life expectancy from 1952 - 2007 for Australia. Life expectancy increases steadily except from 1962 to 1969. We can safely say that our life expectancy is higher than it has ever been!
Australia’s life expectancy has increased a great deal over the past 50 years (See Figure 12.1)
12.6.2 Your Turn
- Add a new plot in your document and reference it
12.7 Referencing a table
To cite a table, you write the following:
Table \@ref(tab:chunk-name))
```{r gg-oz-tab}
gapminder %>%
  filter(country == "Australia") %>%
  knitr::kable(caption = "Raw gapminder data for Australia.")
```
We can see below in Table 12.1 the raw data used to create Figure 12.1).
gapminder %>%
  filter(country == "Australia") %>%
knitr::kable(caption = "Raw gapminder data for Australia.")| country | continent | year | lifeExp | pop | gdpPercap |
|---|---|---|---|---|---|
| Australia | Oceania | 1952 | 69.120 | 8691212 | 10039.60 |
| Australia | Oceania | 1957 | 70.330 | 9712569 | 10949.65 |
| Australia | Oceania | 1962 | 70.930 | 10794968 | 12217.23 |
| Australia | Oceania | 1967 | 71.100 | 11872264 | 14526.12 |
| Australia | Oceania | 1972 | 71.930 | 13177000 | 16788.63 |
| Australia | Oceania | 1977 | 73.490 | 14074100 | 18334.20 |
| Australia | Oceania | 1982 | 74.740 | 15184200 | 19477.01 |
| Australia | Oceania | 1987 | 76.320 | 16257249 | 21888.89 |
| Australia | Oceania | 1992 | 77.560 | 17481977 | 23424.77 |
| Australia | Oceania | 1997 | 78.830 | 18565243 | 26997.94 |
| Australia | Oceania | 2002 | 80.370 | 19546792 | 30687.75 |
| Australia | Oceania | 2007 | 81.235 | 20434176 | 34435.37 |
12.7.1 Your Turn
- Create a table in your document and refer to it in text
12.8 Referencing a section
You can even reference a section in your report:
\@ref(slug))
However, in order to write this, you need to include slug in your markdown header, like so:
## your amazing header {#slug}For example, I can refer to the first section (Section 12) in this document by referring to the section as
\@ref(start)
because it was written as:
# Citing Figures, Tables & Sections {#start}One note here - your slug can not start with a number. Otherwise, it will print out the slug. So the following would not work:
## 10 rules {#10-rules}You should instead write:
## 10 rules {#ten-rules}12.8.1 Your Turn
- Reference a section in the report.
12.9 One small note
If you are using a template of some kind, such as those in rticles, and want the full featured citation features, then your YAML will need to include something like this: