9 Figures, Tables, Captions.
You need figures and tables in your own writing, whether it be a journal paper, an internal document, or some documentation. In this section, we discuss how to add figures and tables into your rmarkdown document, and how to provide captions for them.
9.1 Overview
- Teaching 10 minutes
- Exercises 10 minutes
9.2 Questions
- How do I create a figure in rmarkdown?
- How do I create a table in rmarkdown?
- How do I add captions for figures and tables?
9.3 Objectives
9.4 Tables
To produce a table, I recommend you use the kable function from the knitr package.
9.4.1 Demo
kable takes a data.frame as input, and outputs the table into a markdown table, which will get rendered into the appropriate output format.
For example, let’s say we wanted to share the first 6 rows of our gapminder data.
This gives us the following output
| country | continent | year | lifeExp | pop | gdpPercap |
|---|---|---|---|---|---|
| Afghanistan | Asia | 1952 | 28.801 | 8425333 | 779.4453 |
| Afghanistan | Asia | 1957 | 30.332 | 9240934 | 820.8530 |
| Afghanistan | Asia | 1962 | 31.997 | 10267083 | 853.1007 |
| Afghanistan | Asia | 1967 | 34.020 | 11537966 | 836.1971 |
| Afghanistan | Asia | 1972 | 36.088 | 13079460 | 739.9811 |
| Afghanistan | Asia | 1977 | 38.438 | 14880372 | 786.1134 |
So how does that work? kable prints out the following:
|country     |continent | year| lifeExp|      pop| gdpPercap|
|:-----------|:---------|----:|-------:|--------:|---------:|
|Afghanistan |Asia      | 1952|  28.801|  8425333|  779.4453|
|Afghanistan |Asia      | 1957|  30.332|  9240934|  820.8530|
|Afghanistan |Asia      | 1962|  31.997| 10267083|  853.1007|
|Afghanistan |Asia      | 1967|  34.020| 11537966|  836.1971|
|Afghanistan |Asia      | 1972|  36.088| 13079460|  739.9811|
|Afghanistan |Asia      | 1977|  38.438| 14880372|  786.1134|
And this then gets rendered as a table. This works for HTML, PDF, and word!
9.4.1.1 Adding captions to a table
Now, say that we wanted to include a caption? We use the caption argument. This will also automatically number the table (woo! We’ll cover this later).
| country | continent | year | lifeExp | pop | gdpPercap |
|---|---|---|---|---|---|
| Afghanistan | Asia | 1952 | 28.801 | 8425333 | 779.4453 |
| Afghanistan | Asia | 1957 | 30.332 | 9240934 | 820.8530 |
| Afghanistan | Asia | 1962 | 31.997 | 10267083 | 853.1007 |
| Afghanistan | Asia | 1967 | 34.020 | 11537966 | 836.1971 |
| Afghanistan | Asia | 1972 | 36.088 | 13079460 | 739.9811 |
| Afghanistan | Asia | 1977 | 38.438 | 14880372 | 786.1134 |
Some other useful features of kable include setting the rounding number, with the digits option.
For example, we could present the first 2 digits of each number like so:
| country | continent | year | lifeExp | pop | gdpPercap |
|---|---|---|---|---|---|
| Afghanistan | Asia | 1952 | 28.80 | 8425333 | 779.45 |
| Afghanistan | Asia | 1957 | 30.33 | 9240934 | 820.85 |
| Afghanistan | Asia | 1962 | 32.00 | 10267083 | 853.10 |
| Afghanistan | Asia | 1967 | 34.02 | 11537966 | 836.20 |
| Afghanistan | Asia | 1972 | 36.09 | 13079460 | 739.98 |
| Afghanistan | Asia | 1977 | 38.44 | 14880372 | 786.11 |
There are other options that you can set in kable, but for these options will get you through a large majority of what you need. For more information on what kable can provide, see ?knitr::kable.
There are many different ways to produce tables in R. We have chosen to show kable today because kable is minimal, but powerful. If you want to extend kable to do more, look at kableExtra, in particular the option kableExtra::kable_styling(latex_options = c("hold_position")).
9.4.2 Your Turn
- Create a summary of your gapminder data, and put it into a table.
- Add a caption to this table
- Set the number of decimals to 2.
9.5 Figures
Printing figures is probably my favourite feature of rmarkdown. It is actually relatively straightforward in the case of plots. You provide the plot you want to show in a code chunk!
9.5.0.1 Demo
For example, I can print a plot of the gapminder data for Australia like so:
##
## Attaching package: 'dplyr'## The following objects are masked from 'package:stats':
##
## filter, lag## The following objects are masked from 'package:base':
##
## intersect, setdiff, setequal, union
9.5.1 Captions for figures
Inserting a caption for a figure is a little bit different. The caption argument is controlled in the chunk option, under the option, fig.cap.
So to insert a figure, we do the following.
```{r gg-oz-gapminder, fig.cap = "Life expectancy from 1952 - 2007 for Australia. Life expentancy increases steadily except from 1962 to 1969. We can safely say that our life expectancy is higher than it has ever been!"}
library(ggplot2)
library(dplyr)
gapminder %>%
filter(country == "Australia") %>%
ggplot(aes(x = lifeExp,
y = year)) +
geom_point()
```Which would produce the following output
library(ggplot2)
library(dplyr)

gapminder %>%
  filter(country == "Australia") %>%
  ggplot(aes(x = lifeExp,
             y = year)) +
  geom_point()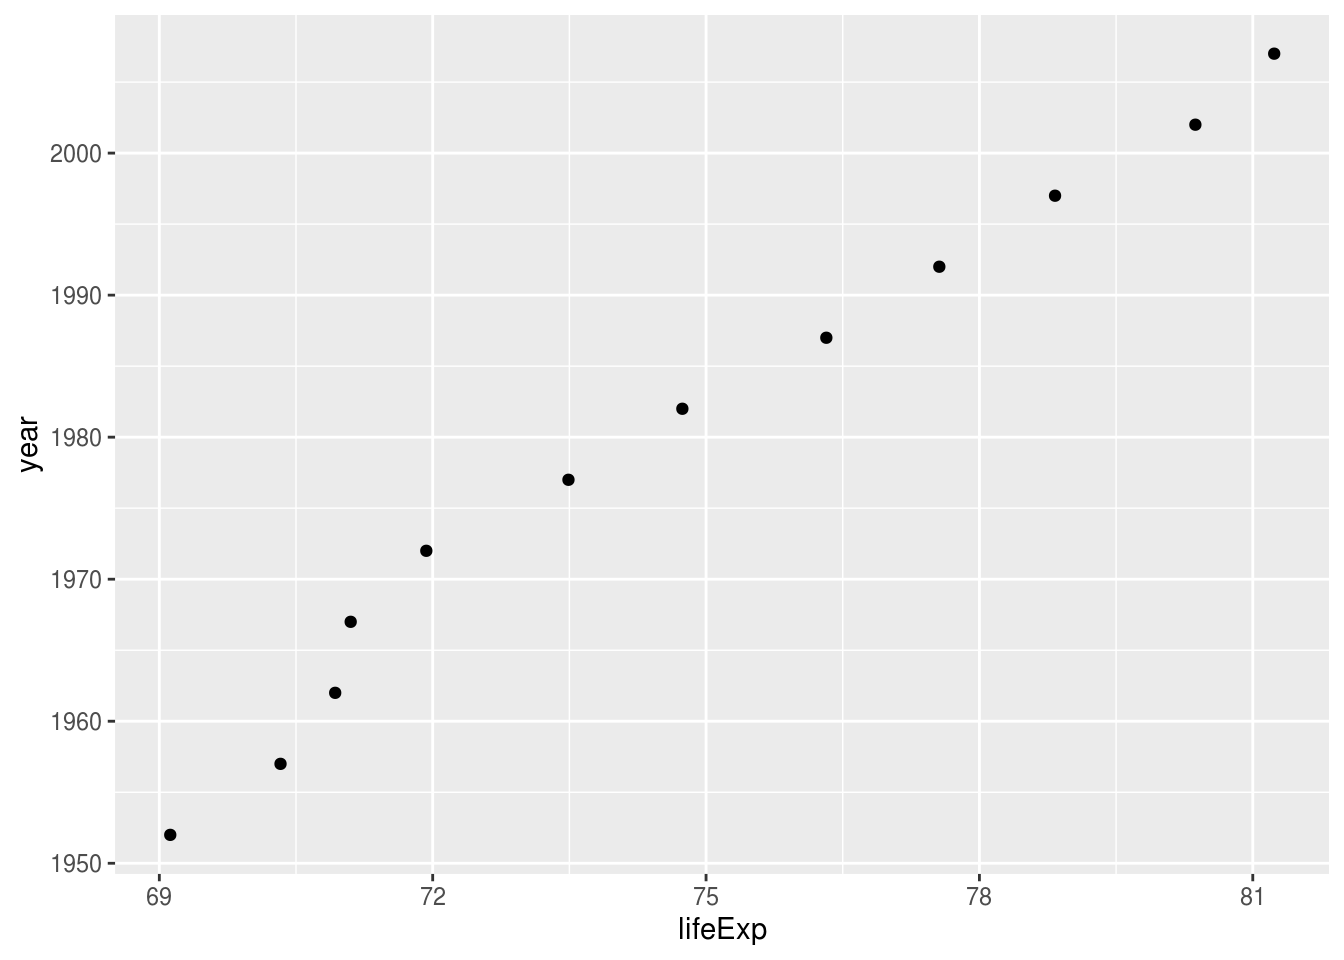
Figure 9.1: Life expectancy from 1952 - 2007 for Australia. Life expentancy increases steadily except from 1962 to 1969. We can safely say that our life expectancy is higher than it has ever been!
9.5.2 Your Turn
- Create a plot with your .Rmd doc
- Add a figure caption
9.5.3 Inserting images
We cannot always generate the graphics that we want - for example, we might have an image of something that we want to show, or perhaps a nice flowchart someone else made.
In our case, say we wanted to insert the new SSA logo into our document, there are two ways we can do this.
- With
markdownsyntax - with
knitr::include_graphics()
Markdown syntax
The markdown syntax to insert an image is: 
9.5.3.1 Demo
So we could insert the new SSA vic logo by doing the following:
Which would give us the following output:
SSA Logo!
But say that we want more control over the output, like we want to center the image, and we want to make it smaller? Then you can use knitr::include_graphics(), and control the figure size using the options out.width, and add a caption with fig.cap.
```{r ssa-logo, fig.align = 'center', out.width = "25%", fig.cap = "The new SSA logo, which is actually a scatterplot, which is super neat!"}
knitr::include_graphics(here::here("figs", "ssa-logo.png"))
```Figure 9.2: The new SSA logo, which is actually a scatterplot, which is super neat!
`
9.5.4 Your Turn
- Download the gapminder logo and put it into a new directory call “figs”
- Insert this image into your rmarkdown document around where you introduce gapminder.
9.6 Summary
We’ve now learned how to insert tables, plots, and images into our documents!